May 2011
Here we give an example of how to create a customer location map using javascript.
The Requirement
Our requirement was to find a way of creating a customer location map that displayed customer locations and key details, such as names and addresses. In addition, we wanted the ability to filter the map results to show only certain categories of customers.
We first created a solution using using Google Maps, Visual DataFlex and JavaScript, then went on to explore how easy it would be to do the same in Microsoft’s Bing Maps.
Solution JavaScript map example using Google Maps
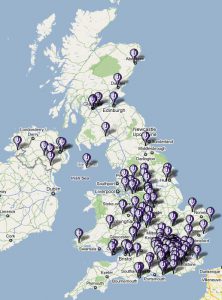
For this customer location map javascript example, we have created a Google Map plotting the locations of Unicorn’s customers across the UK, and indeed around the world.
The example uses a copy of our internal customer database, but only provides anonymised information on the individual customers (the customer names and postcodes are not revealed), although obviously the version we use in-house provides full information.
Our Google Maps solution allows you to select customers by type (we should point out that the type “MAD” refers to “Moving Away from DataFlex” and not to any form of mental instability – a little joke of Carol’s we suspect) and status, after which clicking on the Show Map button will display the locations of the selected customers. Hovering the mouse over each marker will pop-up the (anonymised for this example) customer information.
Creating this page involved a number of steps and technologies.
Our original idea was to simply use the address information we hold on our customers to have the JavaScript code on the page make calls to the Google GeoCoding API to work out the locations to plot. On reflection, this would have involved redundantly geocoding every required location on every page invocation and would have been very slow, but more importantly, Google impose limits of 10 such requests per second (their “request rate limit“) and a total of 2,500 per day (for their free service), so we had to adopt a different approach.
We created a Google GeoCoding client in Visual DataFlex and used that in a program to run through our customer table, storing the returned latitude and longitude results for each row, and pausing for a second every ten requests. It took a little while to process all of our data, but not too long.
With that information stored in the database, the other steps were relatively simple:
- Build a web service that provided customer information, filtered by the requested criteria, including the stored location data (latitude and longitude)
- Create a little Unicorn InterGlobal .PNG marker to use on the map
- Create an HTML web page with the required selection controls on it
- Write a JavaScript program, to be included on the web page, to first call the web service, then use the results as inputs to Google’s Maps API to plot the points on a map using the customised marker icons, with “Info Boxes” containing the customer information set to pop up when the mouse is “hovered” over each marker
Solution JavaScript map example using Microsoft’s Bing Maps
Having done the trick with Google Maps, we turned our attention to one of its main rivals: Microsoft’s Bing Maps. Reproducing the same results proved surprisingly easy, mostly involving substituting Microsoft entities in the JavaScript for the similar Google ones.
If you would be interested in doing something similar for your company, or developing other applications using Google’s or Bing’s rich set of services, please feel free to get in touch.