In December 2021, Mike Peat gave a presentation at ScanDUC 2021 about how to create a DataFlex mapping component, that enables you to display a customised, interactive maps in DataFlex applications.
Mike’s presentation discusses the aspects of what goes into creating a DataFlex mapping component, including:
- the JavaScript mapping library
- the associated DataFlex wrapper control
- the source of the actual map tiles
- the source of data for what to map
A summary of the slides is given below, alternatively see the presentation and if you’re really interested to know more contact us.
Resources for the DataFlex mapping component
- The Leaflet Library (minimal) workspace will be available on GitHub under DataFlex Code:
- As will the sample application workspace I’ve been demonstrating with here, which should – I hope – stand in for documentation of the library by providing an example of the various techniques involved:
Summary of presentation slides
Leaflet
- Leaflet is a JavaScript Mapping Library (other such libraries are available – i.e. OpenLayers, but Leaflet is what I’m using)
- Open source and free (but you’ll need an API key)
- Offers a very wide range of features (only some implemented)
- Extensive documentation
- Support for markers, popups, tooltips, different tile layers, polylines, polygons, circles, fitting maps to features and so on
- Here I am using version 1.6.0; 1.7.1 is current (but things have changed a bit I think – 1.7.1 breaks my code ATM)
- Printing is handled by a plugin: leaflet.browser.print.js
The DataFlex wrapper control
- Obviously this involves two parts:
- The client side JavaScript example
- The server side DataFlex example
The source of the Map tiles
- Mapbox also provides its map tiles (actually .JPEGs) in different resolutions:
- For the map tiles to display we are using Mapbox
- Mapbox provides a number of different tile “styles“:
- Streets
- Outdoors
- Light
- Dark
- Satellite
- Satellite Streets
- Navigation Day
- Navigation Night (so your car’s SatNav doesn’t blind you when driving at night!)
- Mapbox also provides its map tiles (actually .JPEGs) in different resolutions:
- 256×256 pixels per tile (“256”)
- 512×512 pixels per tile (“512”)
- 1024×1024… which is a little… weird; to get this you specify “512”, but then on the end of the URL you add the extra “parameter” (no, not a query-string parameter) “@2x”, so that tiles are rendered to 1024×1024 pixels – myself I can really see the difference, but it is noticeably slower to load
- 512 requires 4 times as many tiles as 256, and 1024 also 4 times as many but higher resolution – probably stick with 256: easier to read!
The data to use
- In most applications you will have an address you want to see on a map, although in some cases you might already have the latitude (“northings”) and longitude (“eastings”)
- There are many different providers of such data, although some are better than others (and some are better in one country or another, typically the US, but YMMV)
- Some are free and some are not – you pays your money (or not) and you takes your choice
The cGeocodeConnector class
- In my demo I have implemented clients for a number of these services (REST APIs), which are all based on a class: cGeocodeConnector, because in most cases they need to do the same things
- Most support three (or fewer ?) kinds of request – all generally using HTTP GET:
- A free text address search string
- A structured address search
- A postcode search
- Then of course you need to parse what you get back from any given service and use it to “draw” your map
- Let’s look at some of those services…
Geocoding providers
- LocationIQ
- Open Mapquest
- Position Stack
- Geocode IO
- OpenCage
- Here Geocoding
- Trimble
- What3Words (this one is a bit different! ?)
- Google (the 800 pound gorilla in this space, but not free!)
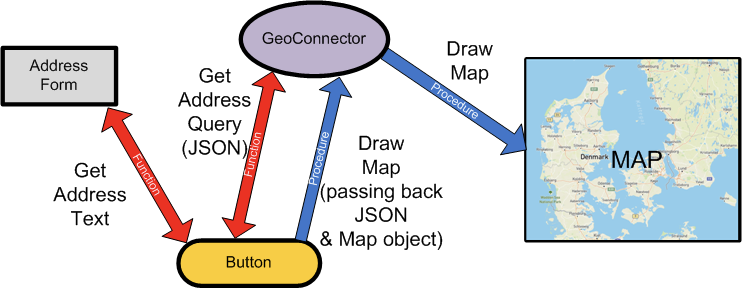
The overall process
- So putting all those pieces together provides us with a mechanism for:
- Entering an address:
- As free text
- As structured text
- As postcode and country
- Submitting that as a query to a service (a REST API)
- Getting results back in JSON
- Parsing that JSON for the data we need
- Using that to draw our map
- Entering an address:
A fuller example
- Let’s take a look at a more fully featured (actually probably somewhat over featured ?) example
- This is the one I use when I’m working out how to interact with various geocoding APIs, so it shows the queries I’m sending to them and the JSON responses I’m getting back
GeoMapping Test demo…
Path tracing (polylines)
- Another thing you might want is to take a GPS trace and show in on a map as a polyline…
- For this I’ve downloaded a number of Public GPS traces people have uploaded from their GPS-aware phones to OpenStreetMap.org
- These are actually XML documents, but I just parse those to get the stream of points (lat/lng) that make up their journey and plot those as a polyline
Path Trace Demo…
Countries (polygons)
- Or we might want to be able to plot specific regions on a map
- For this we’ll use polygons, with a lighter “fill” colour
- As a data source I found a file called countries.geojson from datahub.io
- It’s huge: 23.5Mb! I have the web-app read it on start-up into a UChar array, then store that in a JSON object in the program, while loading an array of the country names and ISO codes so I can select them, so here it is…
Countries demo…
Using the component(s)
- First download and use (as a library) the Leaflet library
- Copy the JS folder from that to your own workspace’s AppHTML directory
- Copy the contents of LeafletIndexSnippet.txt from the library to your Index.html, below the line:
<!-- DataFlex Custom Controls (do not remove this line, used for automatic insertion) -->- That should allow you to use the cLeafletMappingControl in your code, although you will have to acquire your own API key for it from Leaflet
Using the component(s)
- Connectors for the various Geolocation services can be found in the Mapping Sample Workspace (subdirectory “GeoConnectors”), which you can also download
- For the simplest usage example, we can look at the source for SimpleMapTest.wo I first showed you…
Process simple

Some issues
- The Leaflet mapping layers have various dynamically assigned z-index attributes, which can cause problems with them over-lying DataFlex web framework components (such as modal pop-ups and menus)
- To address this, the JavaScript has an “extra” bit on the end which “hides” any mapping component when modal pop-ups are shown and “unhides” them again when it is removed
- This issue is still to be resolved for drop-down menus!
And some oddities ?
- When I initially developed the component, I didn’t really understand the framework’s mechanism for transferring complex data (structs and arrays) to/from the client using value-trees
- So I came up with my own mechanism:
- I create a cJsonObject
- Convert the required data into that (DataTypeToJson)
- Stringify that into a web property (Stringify → WebSet)
- And Destroy the JSON object again
- Then on the client I do JSON.parse of that property into an object variable and work with that
- A bit odd but it (a) seems to work OK and (b) it actually has some advantages over the value-tree approach in that you don’t need to define a fixed data structure in your JavaScript